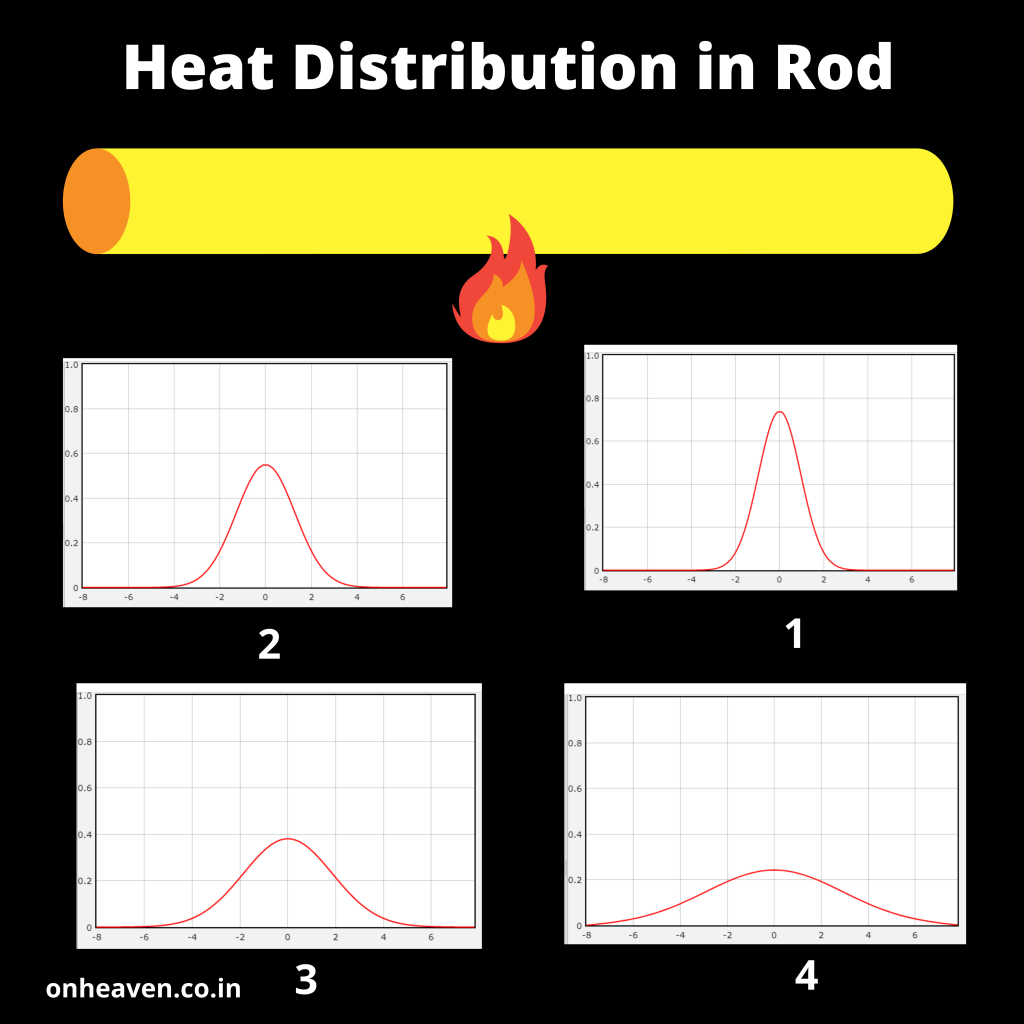
This is the computation representation of heat distribution on rod, shown in diagram given below.
Representation of heat distribution when it applied on the middle part of the rod.
Here, Rod is the perfect conductor of heat.
In this four diagram the vertical axis represents the magnitude of heat, and horizontal axis represents the volumetric flow rate of heat on the rod.
In diagram 1: Just instantaneous after heat is applied to the middle part of the rod, you can see the high peak in curve (shown in red color in diagram given below) represents the magnitude of the heated part of rod. And then after that heat supply removed.
In diagram 2: As passage of time heat stars flowing from the middle part to the rest of the part of the rod in order to maintain the constant temperature in whole rod. As shown in diagram given below, the peak of the magnitude of heat in the middle part of rod decreases, and starts redistributing throughout the whole rod in a volumetric flow rate.
In diagram 3: Magnitude of heat in middle part of the rod decreasing and redistributing throughout the whole rod in a volumetric flow rate.
In diagram 4: Magnitude of heat in middle part of the rod is continuously decreasing with passage of time and redistributing throughout the whole rod in a volumetric flow rate.

Reference:
[1] Let’s Code Physics. “Intro to Difference Equations (Computational Quantum Mechanics 1).” YouTube, 6 Jan. 2020, www.youtube.com/watch?v=pEJiUnLpxLk. Accessed 2 Feb. 2021.